Data Visualisation using Matplotlib
Step 1: Observe the code editor and read the instructions.
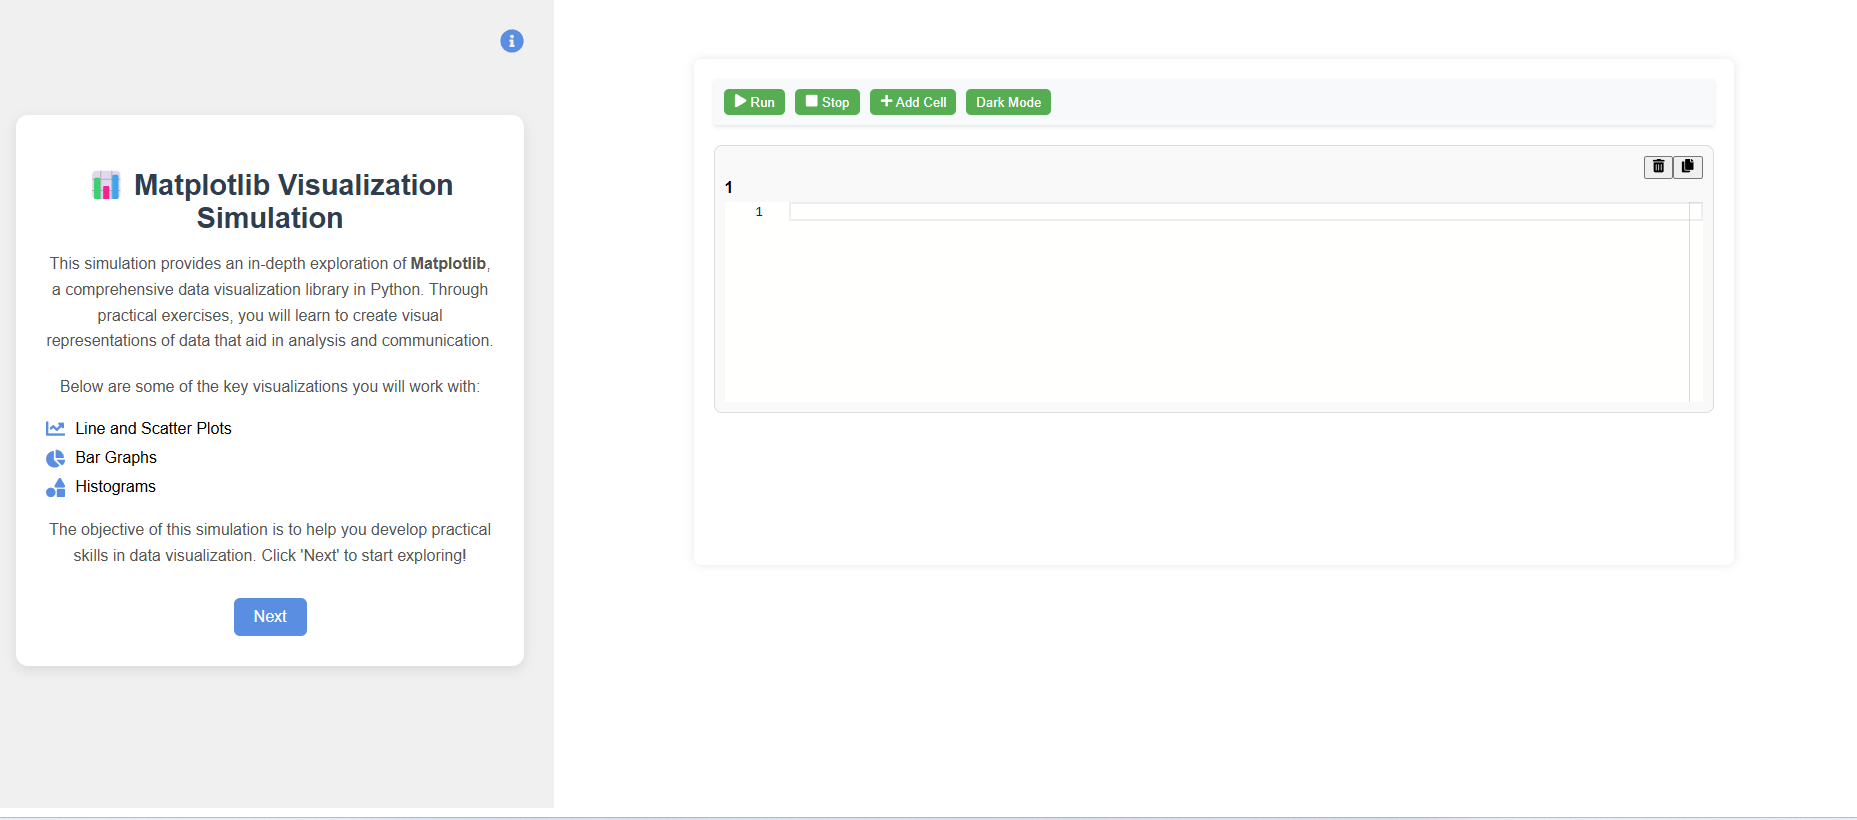
Step 2: Click the "Next" button to explore different Matplotlib plots such as bar plots, histograms, and line plots.
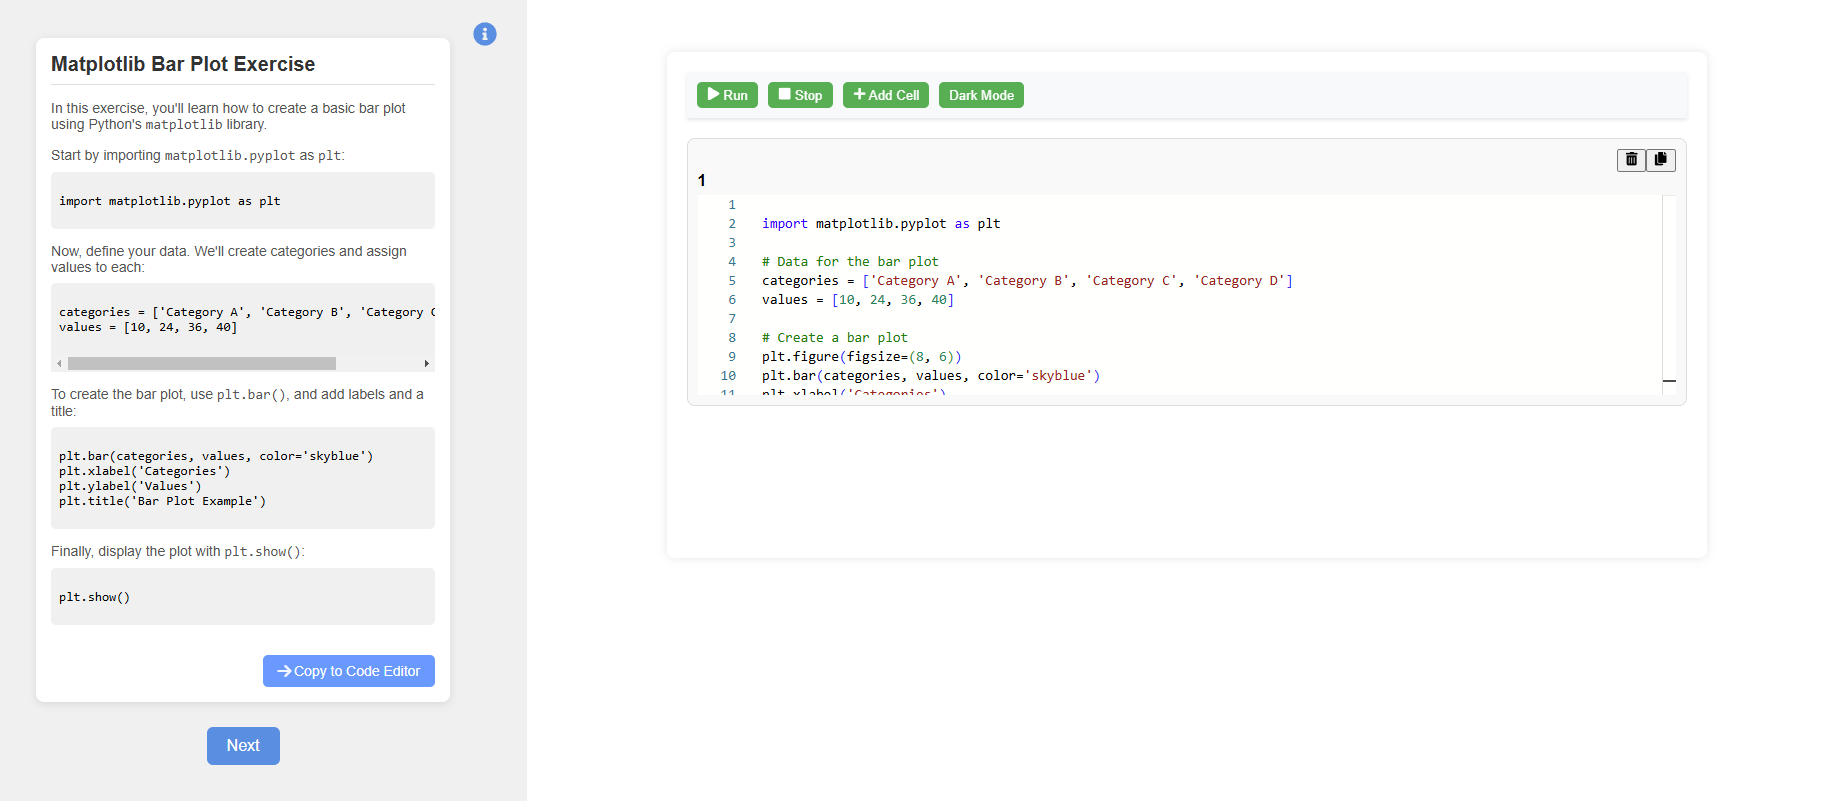
Step 3: Click the "Copy to Editor" button to try out the code in the code editor.
Step 4: Click the "Run" button in the code editor to observe the plot and read the insights.
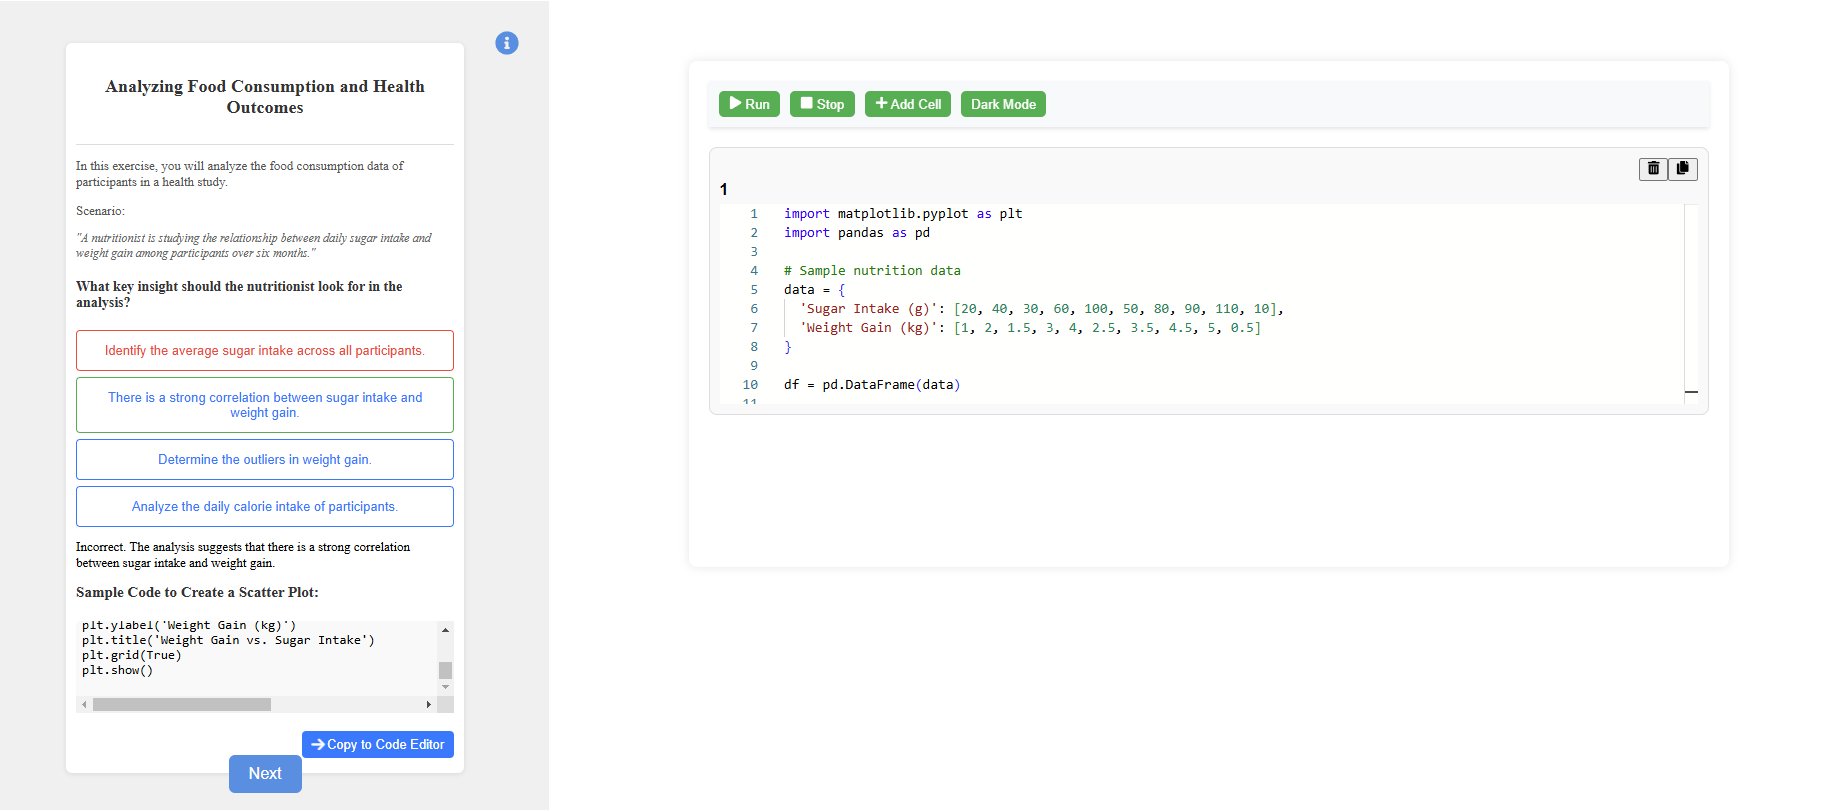
Step 5: After completing the three plots, we will explore Matplotlib with some real-world scenarios.
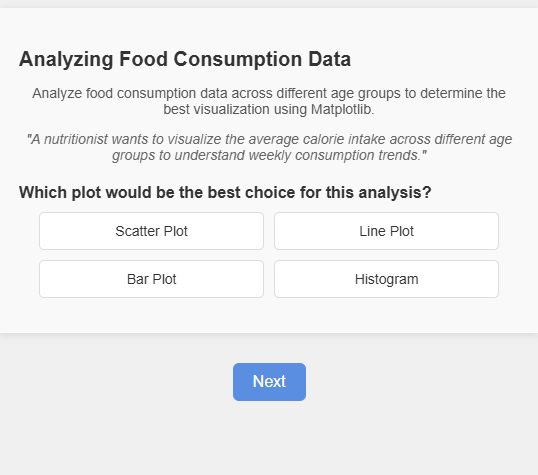
Step 6: Read the instructions, choose the correct option, and after submitting, review the explanations provided.
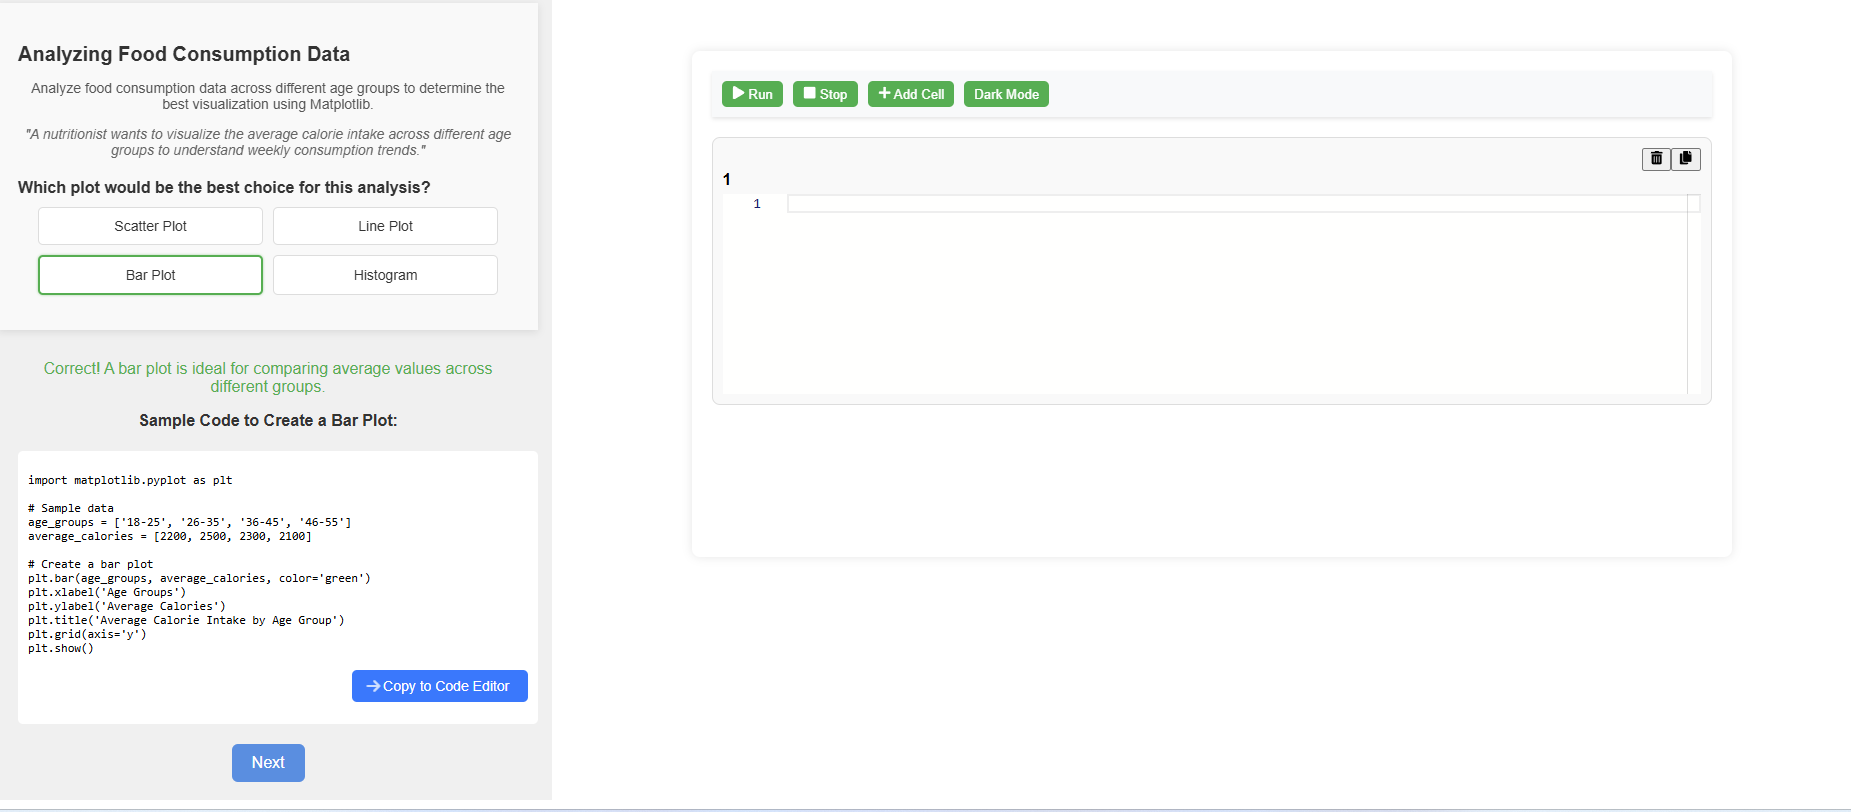
Step 7: After completing the exercise, click the "Code to Editor" button to try the code in the code editor and observe the results.